
View results
Overview
This guide walks through how to view and analyse results from a single quiz, including Guttman Chart view and exporting results.
Steps
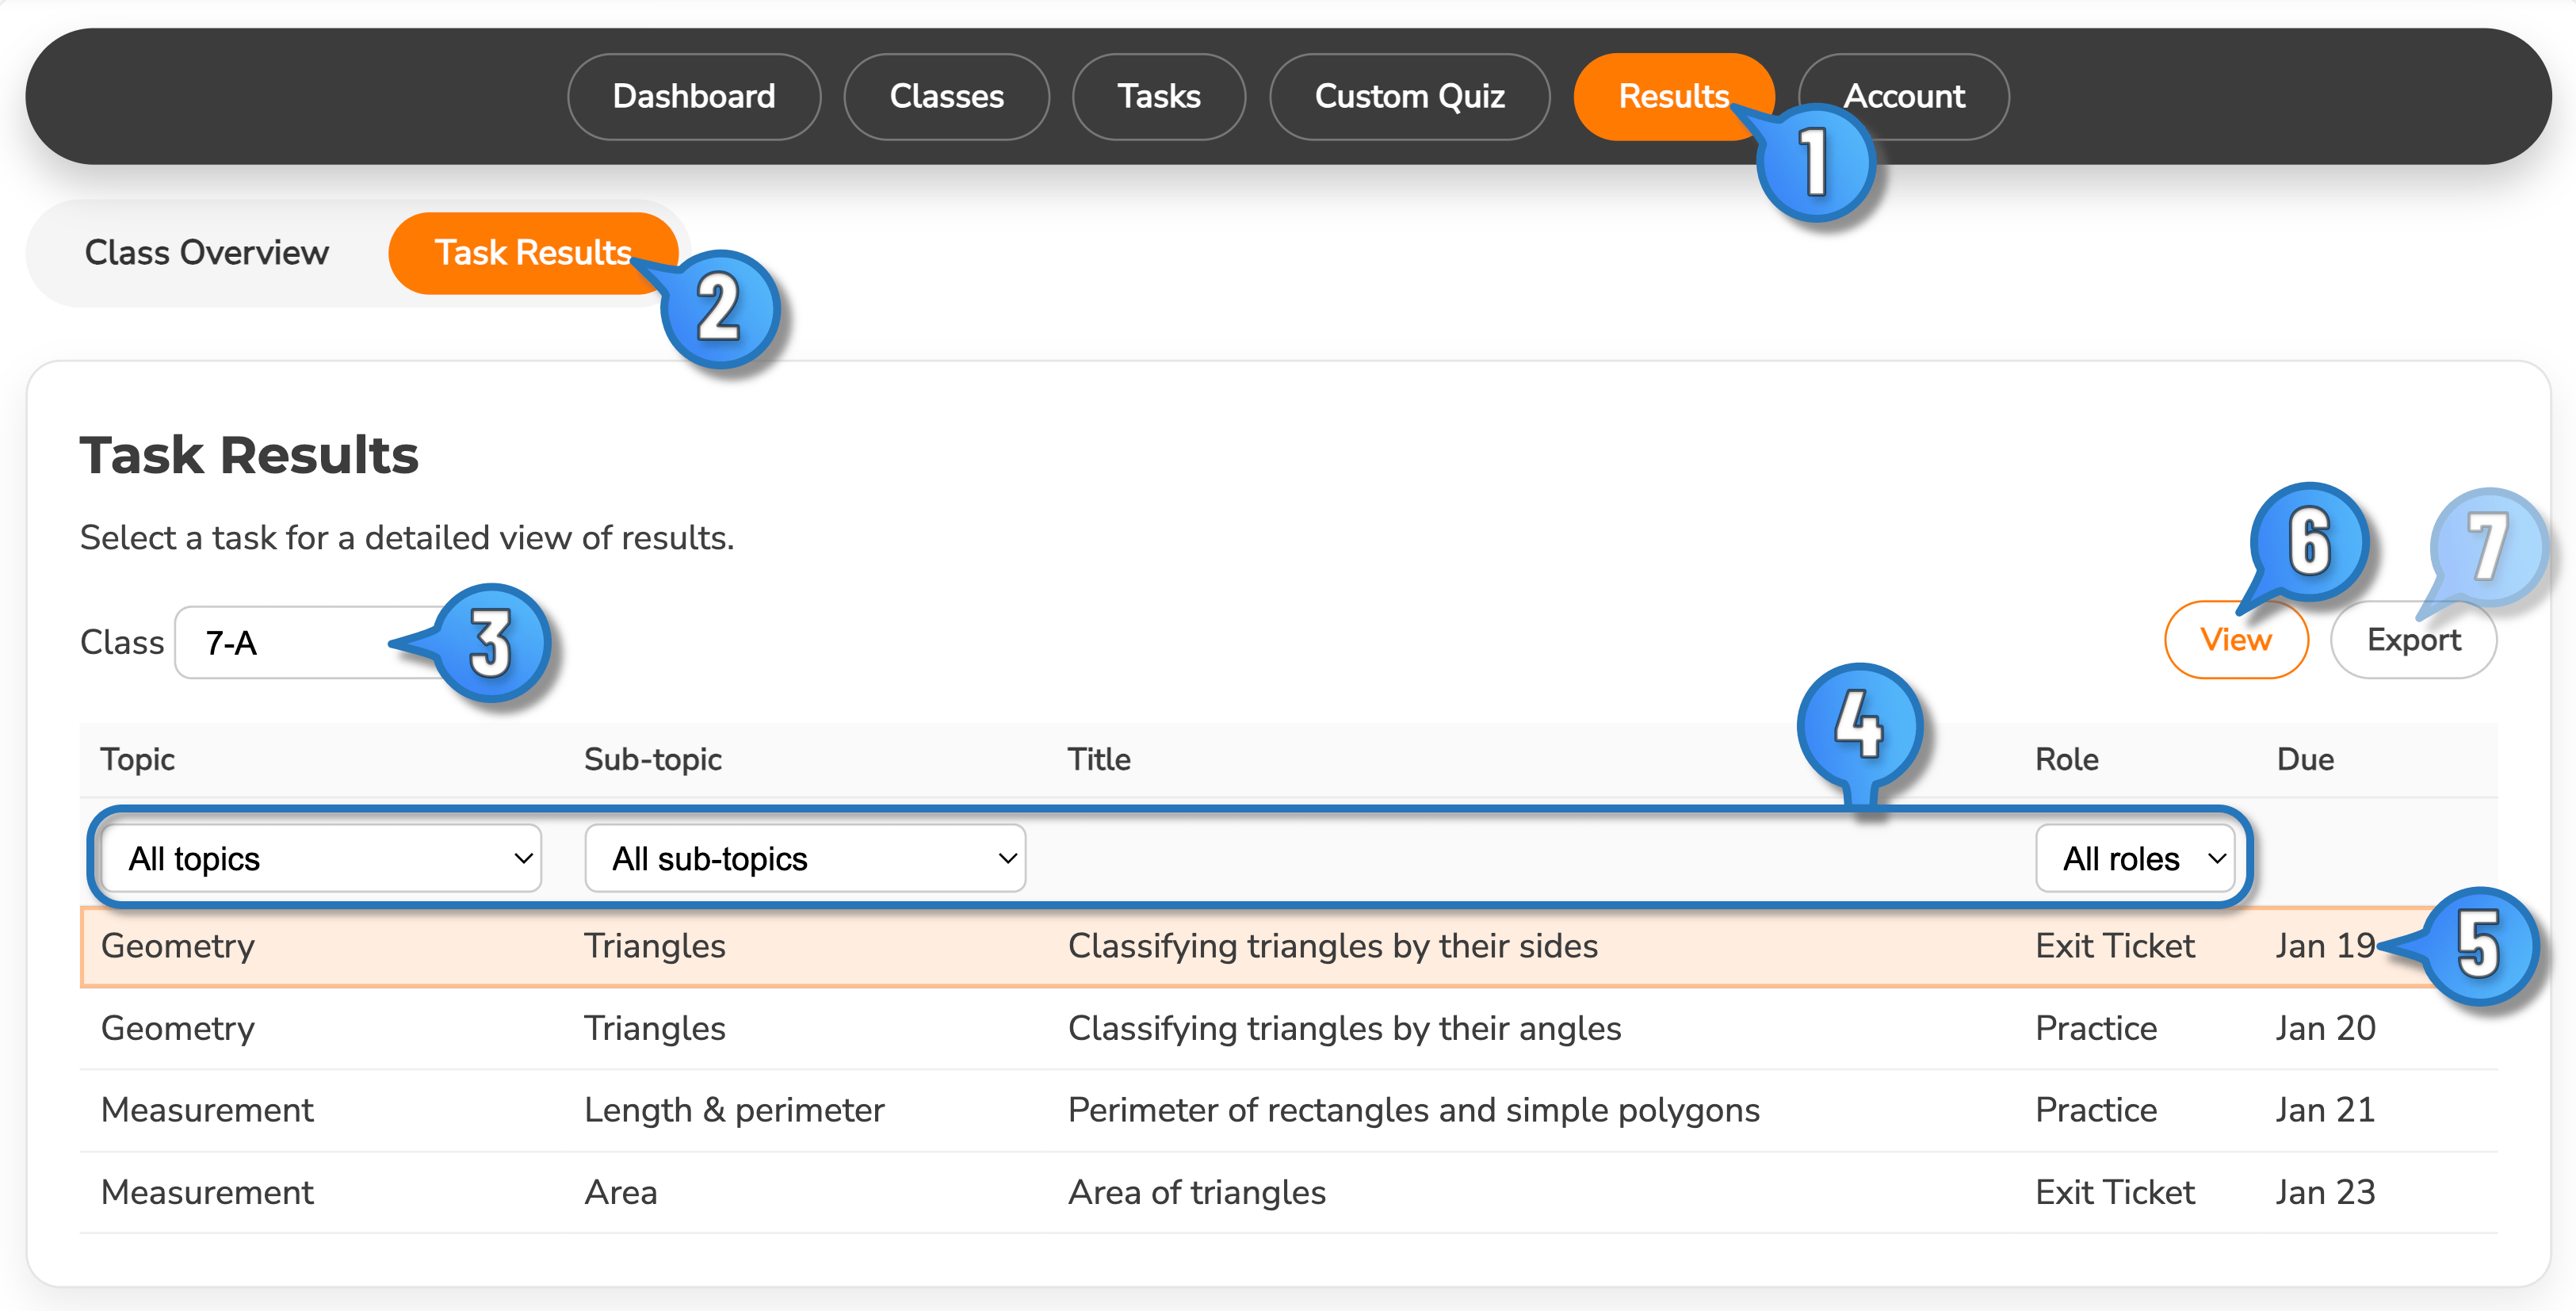
- Select Results from Teacher Dashboard.
- Select Task Results.
- Use select-box to choose the relevant class.
- Use filters to focus-in and find the quiz of interest.
- Click on the quiz of interest within the table to select it.
- Click View to see results.
- Optional: Click Export to export selected quiz results out as a comma separated value (csv) file.
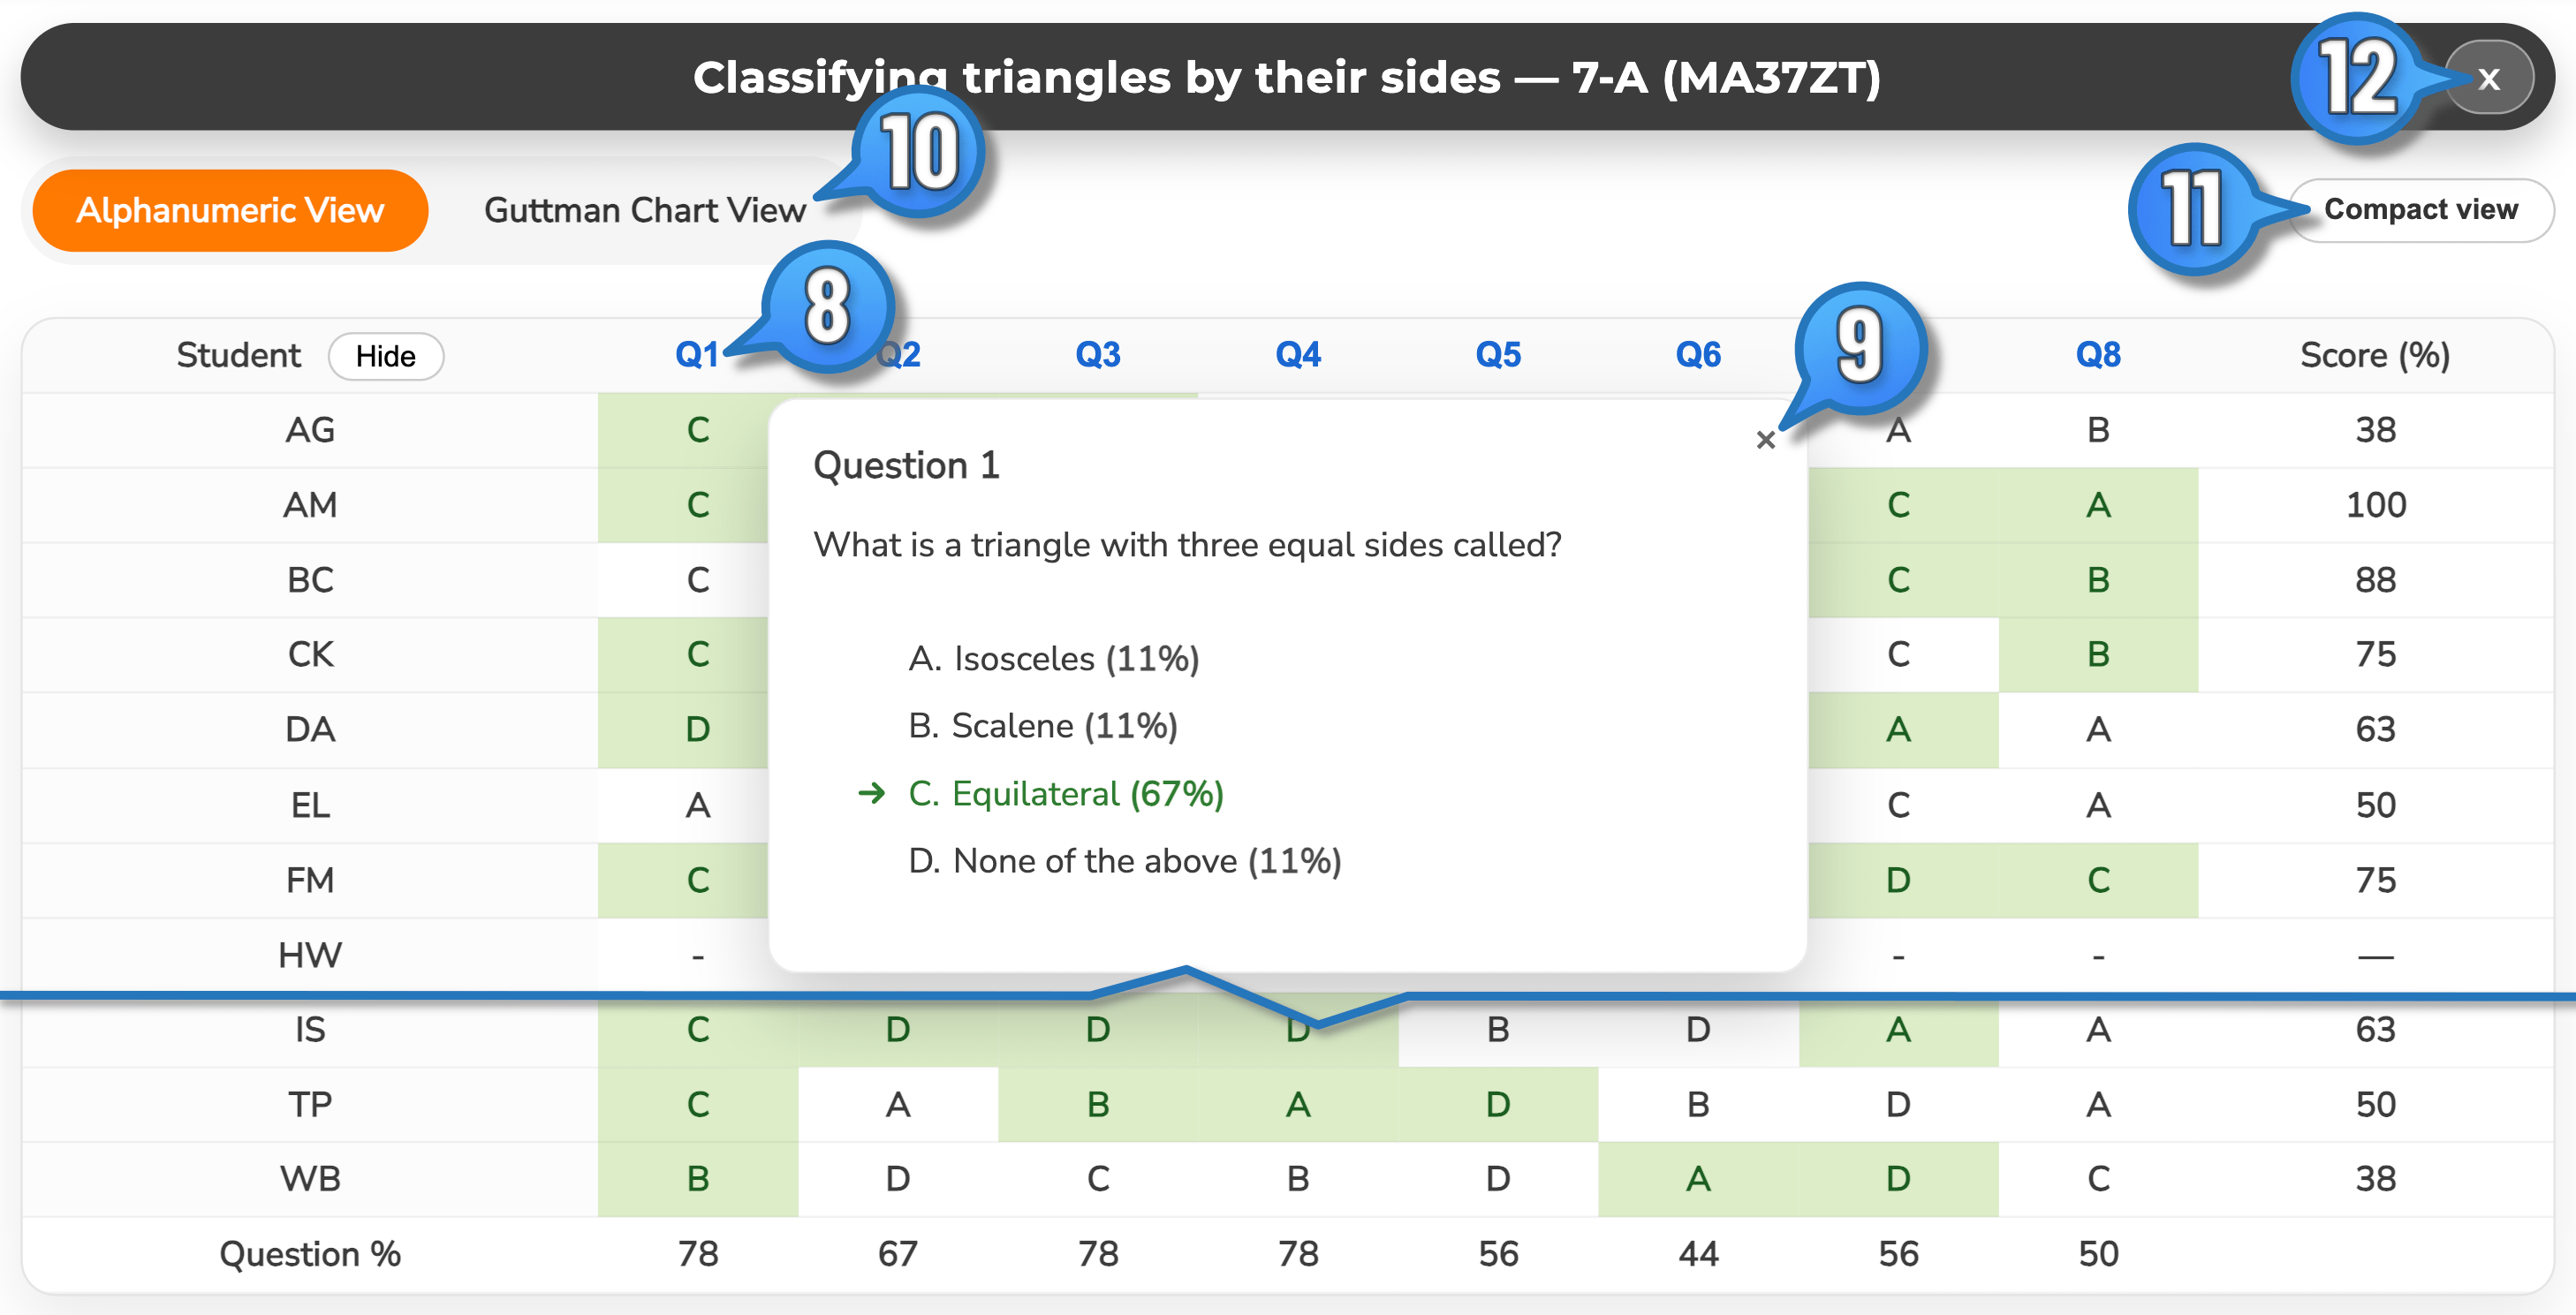
The default Alphanumeric View will display, showing the answer for each student per question. The cell contents (A,B,C or D) shows their chosen answer. Green cells indicate correct answers.
Possible interactions with this view include:
- Click on a question in the table header row for a pop-up of the question, indicating the question answers and percentage of responses per each option. The correct answer is marked in green with an arrow.
- Dismiss the pop-up with the close button
- Shrink the contents to see more on the screen with the **Compact View** option
- When finished, click to close and exit the Results view for the selected task.
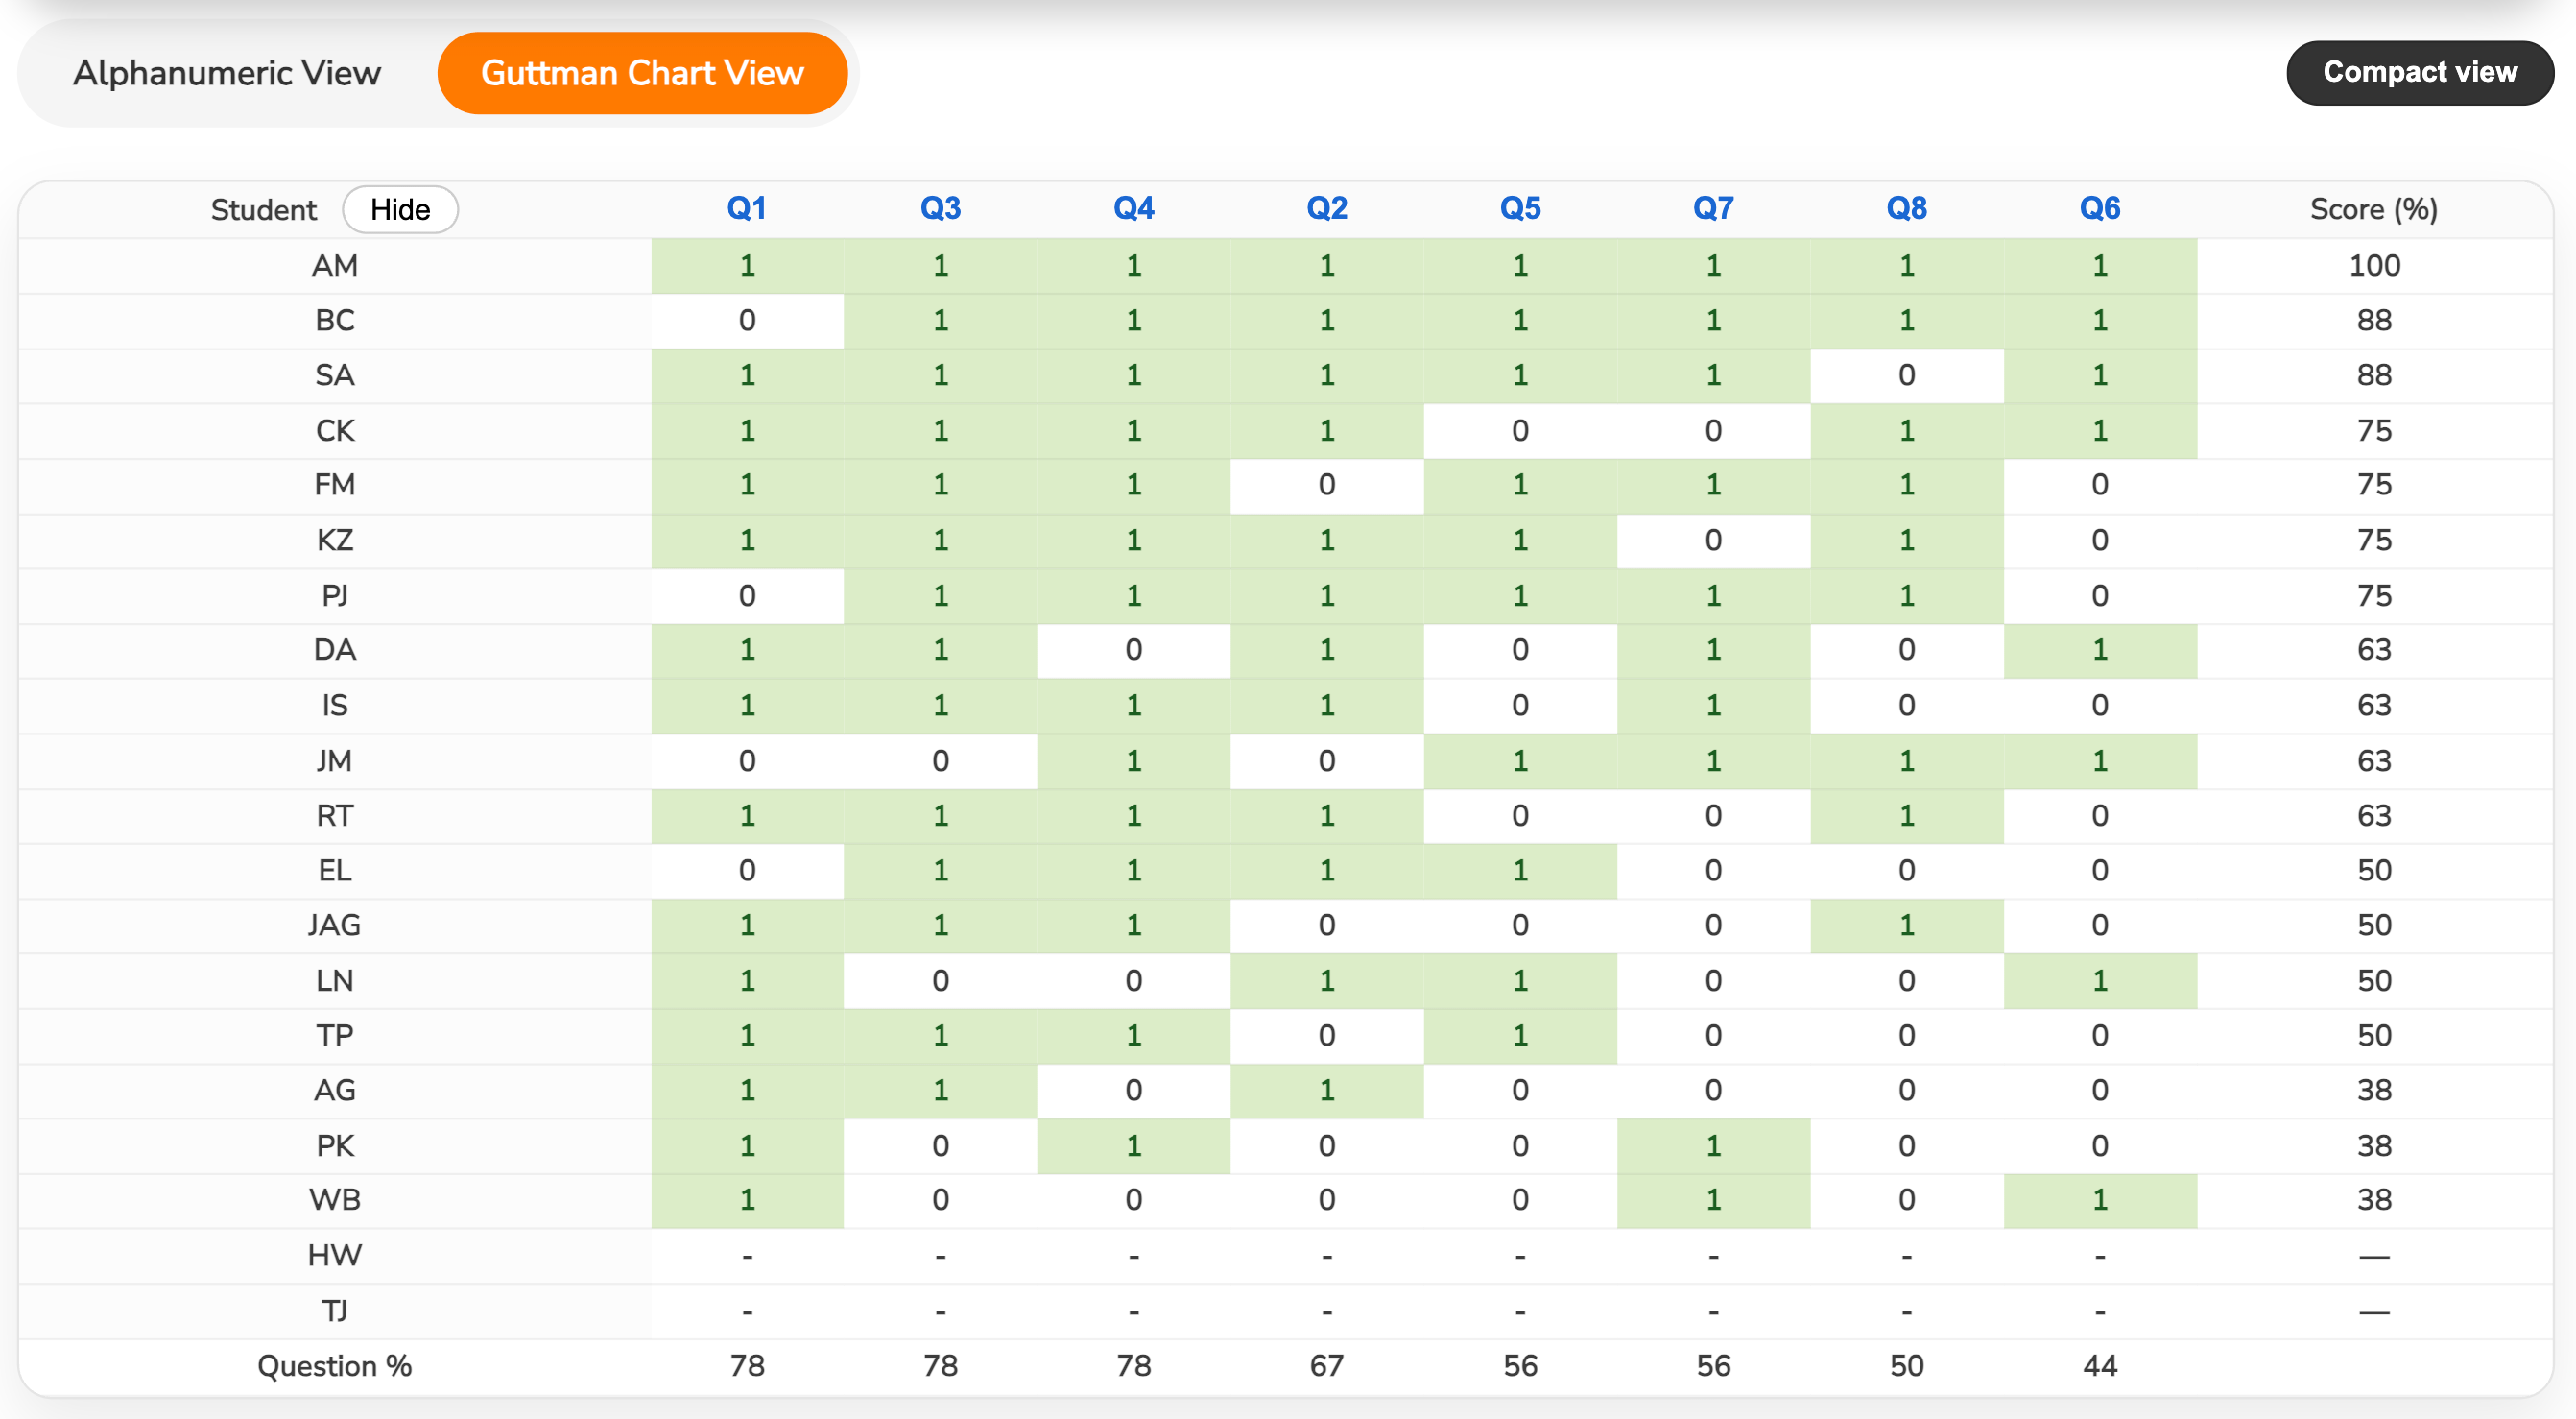
If you toggle the view to Guttman Chart, rows and columns are sorted to help you analyse class performance. For example, use the results to identify questions or skills that need revisiting for the whole class, or group students based on current data into smaller, flexible groups for extension or additional instruction.
You can also View Results for any of your most recent quizzes immediately from the Teacher Dashboard, which provides a convenient summary of recent quizzes.